Knowing how to understand your website data is crucial for your business. It can help you evaluate your performance, understand customers and gain marketing insights, and make informed decisions about your marketing activity.
However, if you don’t understand what the data means, you can’t use it to your advantage or improve the areas in which you’re falling down.
As of the the 1st July 2023, Universal Analytics (UA) stopped processing hits from your website or app and was fully replaced with Google Analytics 4 (GA4), leaving many people with a limited understanding of how to use GA4. More can be found on the changes to Google Analytics in our previous blog.
In July’s learning slot, marketing experts Jag Panesar and Matt Judd discussed five ways to understand your website data to gain more enquiries that’ll help you achieve your business goals.
Why 80×20?
80×20 is a series of events created by Xpand that allow you to learn about the latest in the digital marketing world while getting the chance to network with other business owners and marketing professionals.
In July we covered…
In July’s ’20 minute mastery’, the subject was – Five ways to understand your website data to gain more enquires
Once you understand your website data and use it effectively, you can enhance your online presence, attract more enquiries and drive business growth.
Attendees learned:
- Identifying the sources of traffic to your website to understand where your visitors are coming from.
- Monitoring the performance of your landing pages and making sure the content aligns with visitors’ expectations.
- Understanding standard events and creating events for important actions.
- Connecting your Search Console and seeing what people are searching for to find your website.
- Getting your data retention setting right.
Video
Slides
Getting traffic to your website is one thing. You could be getting traffic from Search Engine Optimisation (SEO), social media, Pay-per-click (PPC), email, etc but converting this traffic into an enquire is another thing entirely, and that’s what you should be aiming for. This is where understanding your website data comes in. It is a fundamental thing.
You may think you want a new website, new branding, or to start posting more social media content, but it’s the analytics and data that makes it happen.
But what is website data, and why do you need it?
Website data is the collection, reporting and analysis of your website’s performance.
Website data is like having a car dashboard for your online business. It provides you with real-time information about your journey.
By understanding your website analytics, you can:
- Identify which parts of your website are most popular.
- Identify where visitors are dropping off.
- Understand which marketing efforts are generating the most traffic.
It can drive your business to success.
If you know what you’re doing with your website data, then it can be the hub of where anything is going to happen because we live in a digital world.
Understand your website data – where do you begin?
1. Identifying the sources of traffic to your website
You need to know where your visitors are coming from. First, you’ll need a Google Analytics 4 account attached to your website.
In Google Analytics 4, use the navigation down the left hand side. You’ll go to reports and then navigate yourself to lifecycle. Once there, you click on acquisition and then traffic acquisition.
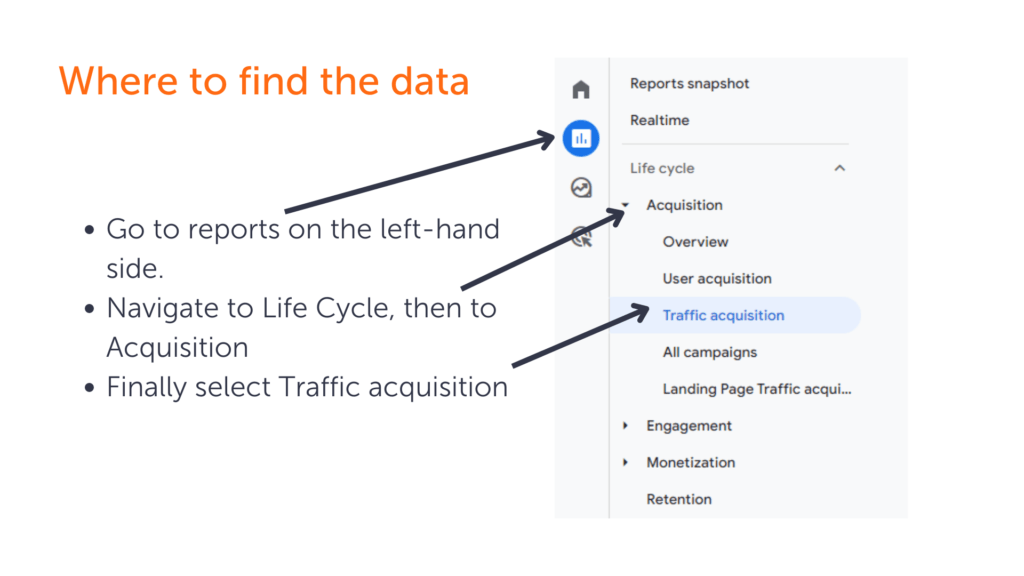
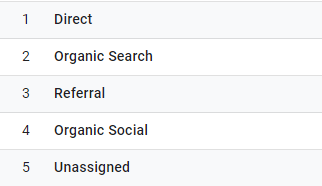
This will give you a table full of data featuring different types of traffic sources. There are many different types of traffic sources depending on what you are running at this moment in time. Five of these traffic sources are:
- Direct – This is where someone will directly type your website into the URL. They know who you are and are aware of you. They either are already a customer, or they’ve had a touchpoint with you.
- Organic Search – This is when someone searches your company or sector in a search engine, and you feature in the search results below the paid advertising section. Organic traffic is the golden cup that everyone aims for.
- Referral – Referral traffic is the traffic that comes from another website that has a link on it to your website.
- Organic Social – This is from any link on a social media site and measures where that comes from.
- Unassigned – This is traffic that hasn’t been assigned a tracking URL and doesn’t fit into any of the other different types.
Example:
Other traffic sources include Paid Shopping, Paid Search, Paid Social, Paid Video, Paid other – these are all traffic from various sources of paid advertising. Other organic sources of traffic are Organic Shopping and Organic Video. More traffic sources include Email, Cross-network, Display, Affiliates, Audio, SMS and Mobile Push Notifications.
Why does this matter? You get to see what channels are driving the most traffic and where to focus your marketing efforts. If you’re getting a lot of organic search and social media traffic, it means you’re doing something right in terms of your SEO and social media.
It’s just a starting point. You need to understand where you are now before you want to get to where you want to go.
2. Monitoring the performance of your landing pages
You need to make sure that your content aligns with visitors’ expectations.
These landing pages are for all pages on your website, not just specific web pages you might have set up as landing pages.
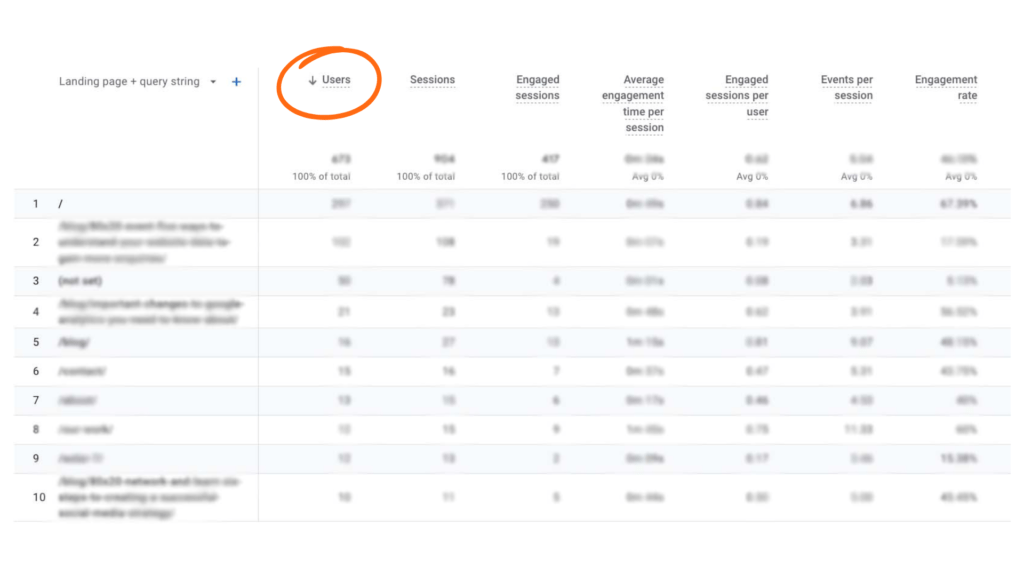
You’ll get another table of data. Each column represents a different section of this data. These are:
- Users – This is the total number of active users.
- Sessions – The number of people actively on your website. Sessions time out after 30 minutes of inactivity.
- Engaged sessions – The number of sessions that lasted longer than 10 seconds, had a conversion event or had two or more screen or page views.
- Average engagement time per session – User engagement duration per session.
- Engaged sessions per user – Number of engaged sessions per user (Engaged sessions/Users).
- Events per session – The average number of events per session.
- Engagement rate – The percentage of engaged sessions (Engaged sessions divided by Sessions).
Example:
3. Understanding standard events and creating events for important actions
There are two types of events in GA4, standard and created.
What’s the difference? GA4 automatically creates standard events and tracks them because it sees them as useful.
Standard events can track page views, scrolls (how far down a page someone’s going), outbound clicks (clicks to other sites), site search, video engagement and file downloads.
For example, if you put loads of work into an amazing piece of content and set it as a file download on your website and no one’s used it. It means something is wrong. Is it the content? Is it where it’s placed on the site? Again, it goes back to the work that you put into your marketing.
It’s this kind of information that’s actually going to give you an outline of if it is working or not working.
Created events are events created by you for a custom report. This gives you the opportunity to be more specific. The type of things you would want to create an event for would be, for example, contact form completions. You want to know how many people have filled in the contact form, and it can tell you where that’s come from. Other examples include:
- Page view – e.g. A thank you page on form submissions.
- Any link click – e.g. Clicks on particular CTA’s or menu items.
- Login tracking.
- Tracking each stage of a funnel to analyse where users drop-off on your website.
Depending on what you want the user journey to look like, you can track that with events. It will tell you everything you need to know.
4. Connecting your Search Console
Search Console is a free web service offered by Google, that helps you monitor, maintain and troubleshoot your site’s presence in Google search results, and you can connect it to your Google Analytics.
Search Console:
- It checks your website indexing status. Indexing is Google’s way of being aware of your website.
- You can see search queries. This is what people are searching for to find your website, e.g. plumber Leeds.
- Optimises the visibility of your website. This is your SEO.
What does Search Console show you on GA4:
- Queries – These are the phrases that people are finding you e.g. marketing agency Bradford, dentist Leeds, etc. This will also show you the number of Google search clicks, impressions, click-through rate and the average position of the query on Google search results.
- Organic search traffic – This will show you the same as the above but will show specific pages on your website.
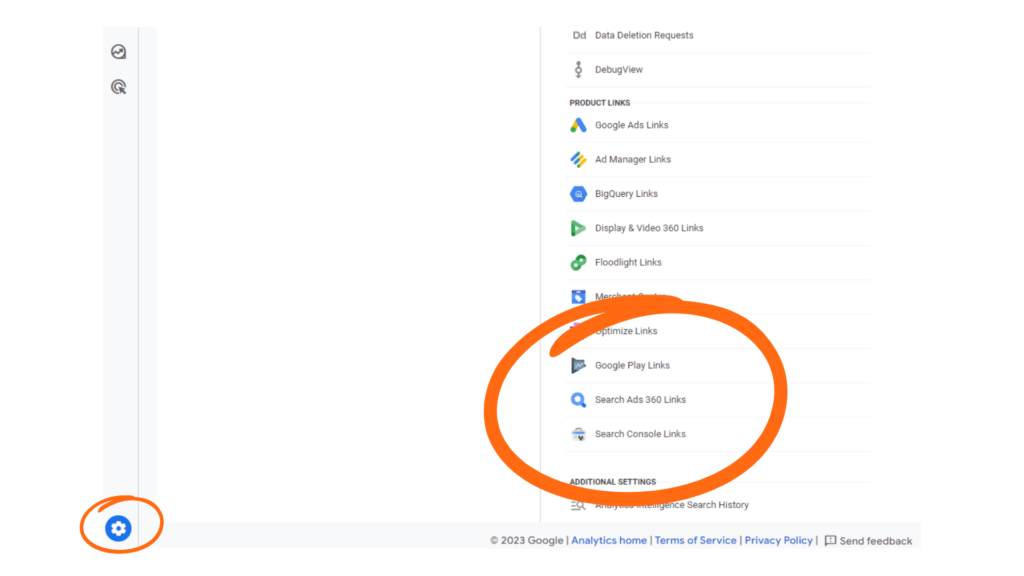
To connect your search console to your GA4. You need to go to admin, then scroll to the property column and go to product links. Scroll down to search console links, then click link and finally click confirm.
5. Getting your data retentions settings right
On the previous version of Google Analytics, you could see years and years of data.
Now you’ve got to change your data retention settings. You can choose between two and 14 months, so you can only see up to 14 months’ worth of data, and you need to ensure you switch it to 14 months as soon as possible.
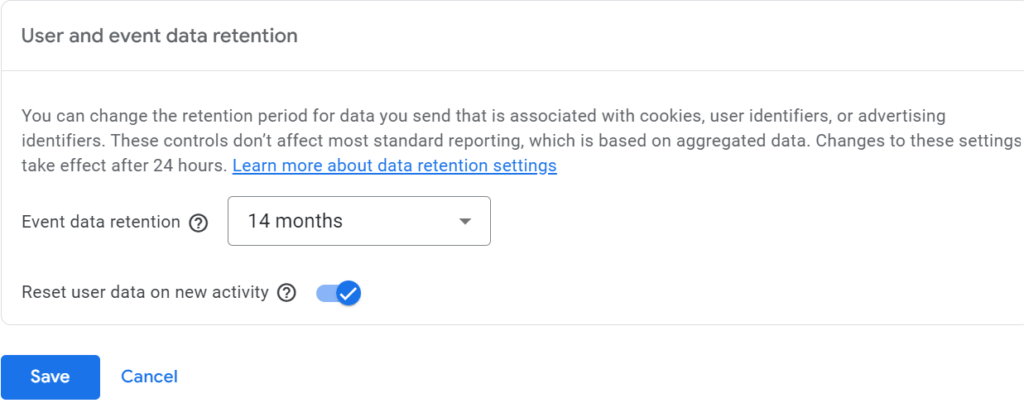
How do you do that? In GA4, if you navigate to the settings on the navigation on the left hand side. You need to go to account access management. Then you need to look at data settings. Then you need to click on data retention, then click on the dropdown and select 14 months.
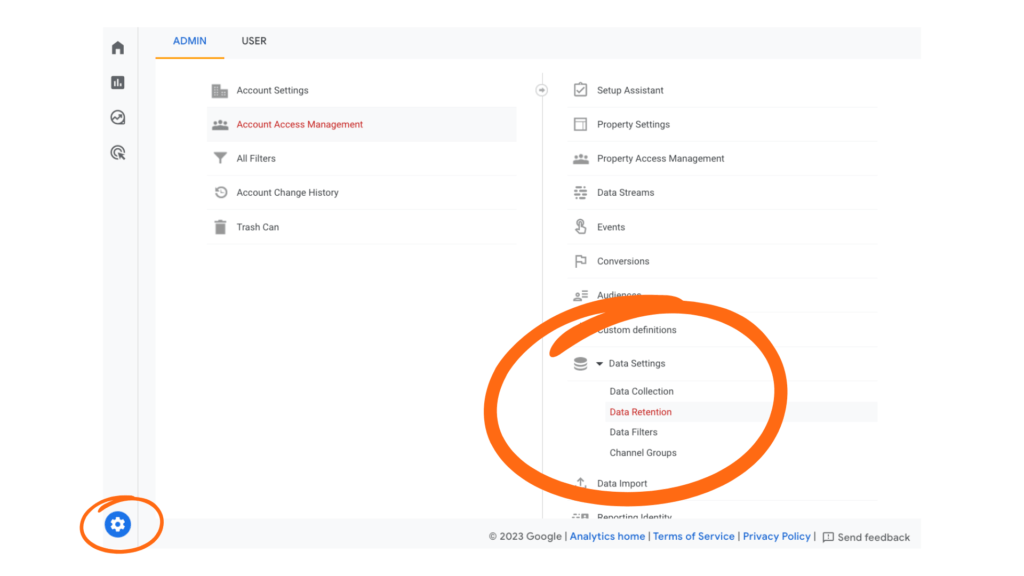
It’s best to have it set to 14 months because you’ll be able to see at least 12 months’ worth of data. This will help you to be able to track seasonal spikes and blooms, and slumps in your industry.
Hopefully, now you have a better understanding of your website data that will help you gain more enquiries.
Remember, this only covers the top-level points. When managing a client’s GA4 account, we go into much more detail. Contact us for assistance in managing your GA4 account.


